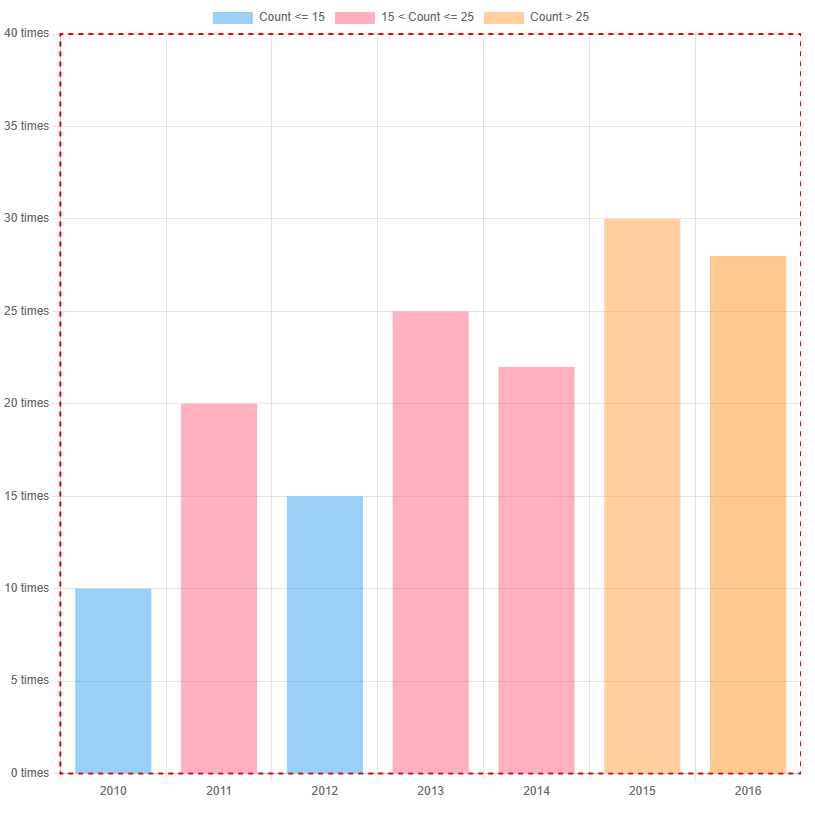
Another way to customize the chart is by using plugins. You can employ plugins created by other developers or create your own. The tutorial demonstrates how to create an ad-hoc one that adds a border to the chart.
const chartAreaBorder = {
  id: "chartAreaBorder",

  beforeDraw(chart, args, options) {
    const {
      ctx,
      chartArea: { left, top, width, height },
    } = chart;

    ctx.save();
    ctx.strokeStyle = options.borderColor;
    ctx.lineWidth = options.borderWidth;
    ctx.setLineDash(options.borderDash || []);
    ctx.lineDashOffset = options.borderDashOffset;
    ctx.strokeRect(left, top, width, height);
    ctx.restore();
  },
};

(async function () {
  const data = [];
  new Chart(document.getElementById("draw"), {
    type: "bar",
    plugins: [chartAreaBorder],
    options: {
      aspectRatio: 1,
      scales: {
        x: { stacked: true },
        y: { max: 40, ticks: { callback: (value) => `${value} times` } },
      },
      plugins: {
        chartAreaBorder: {
          borderColor: "red",
          borderWidth: 2,
          borderDash: [5, 5],
          borderDashOffset: 2,
        },
      },
    },
})();
References
- put some references